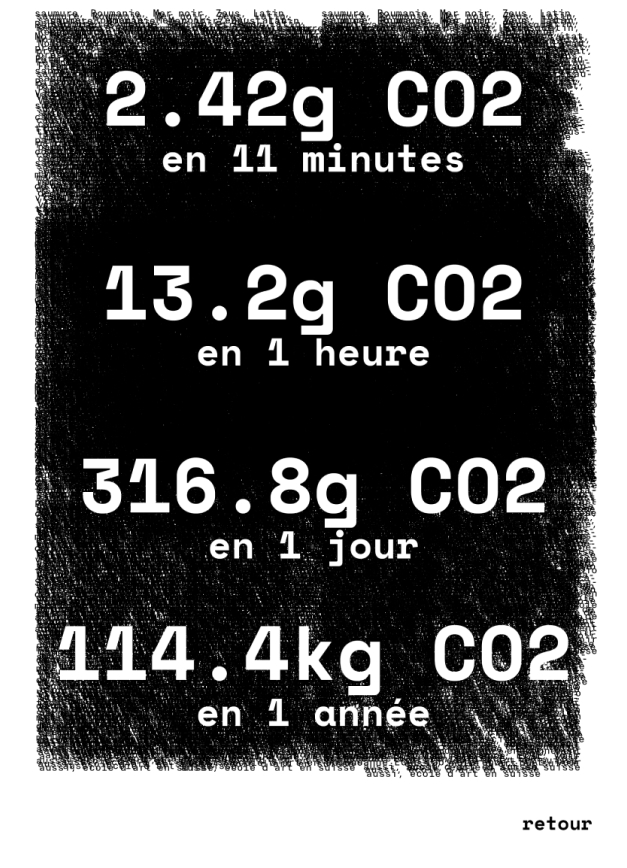
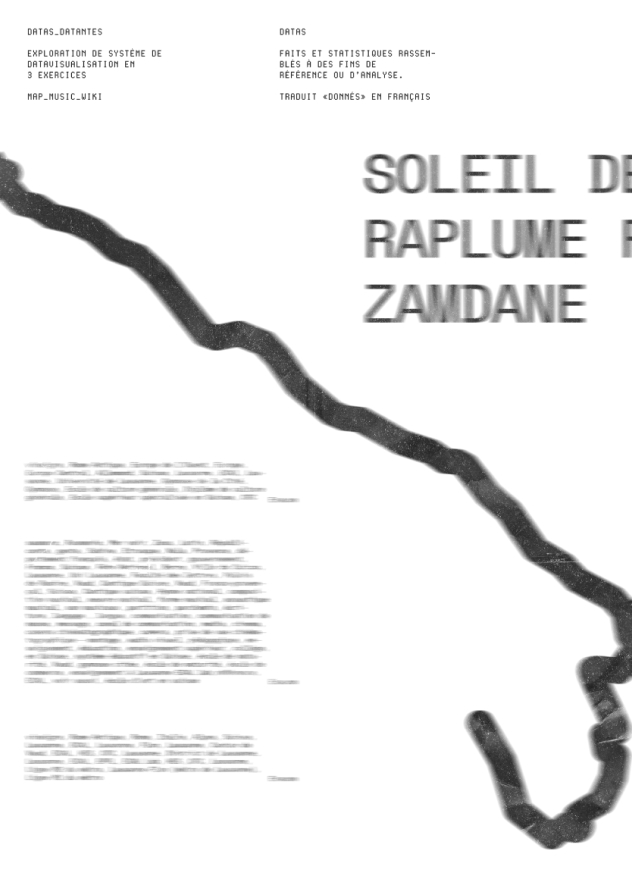
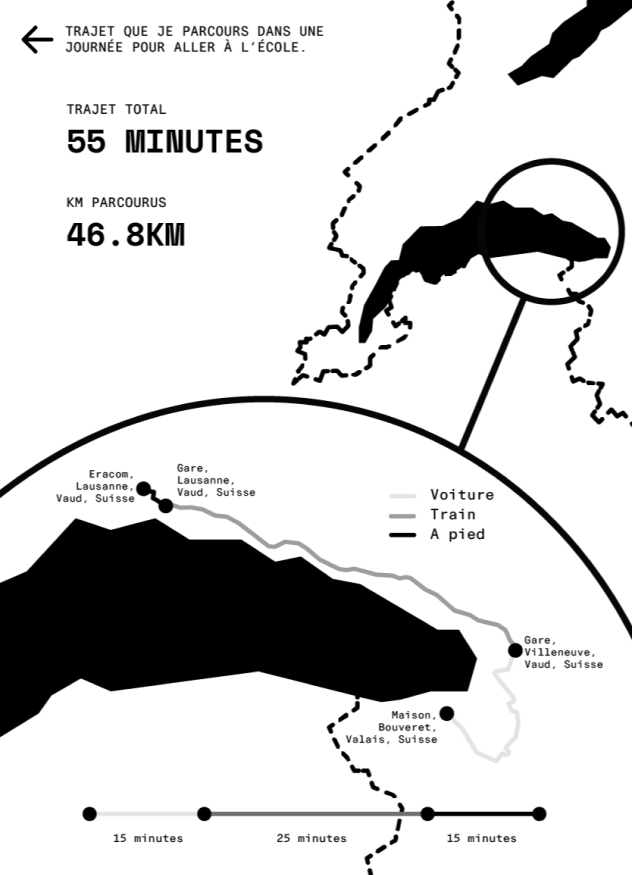
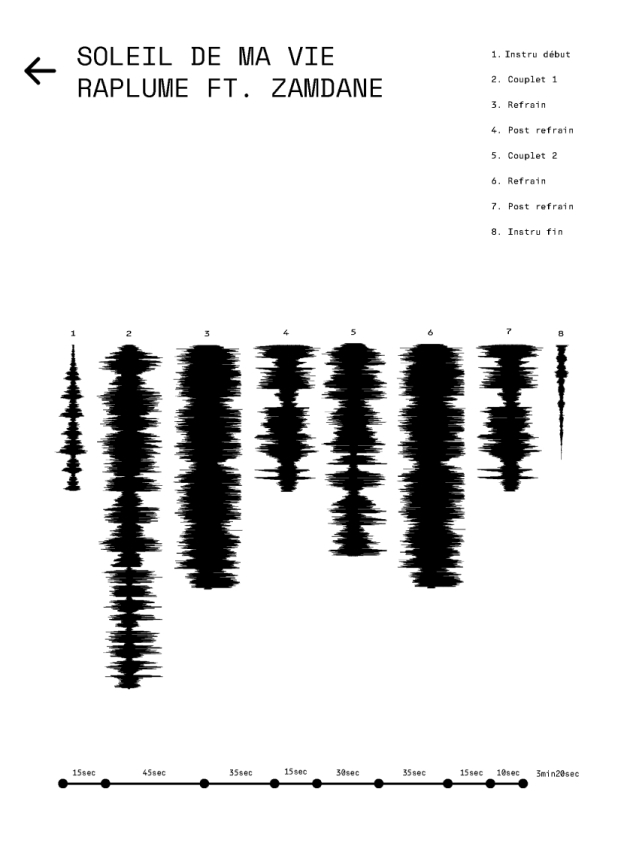
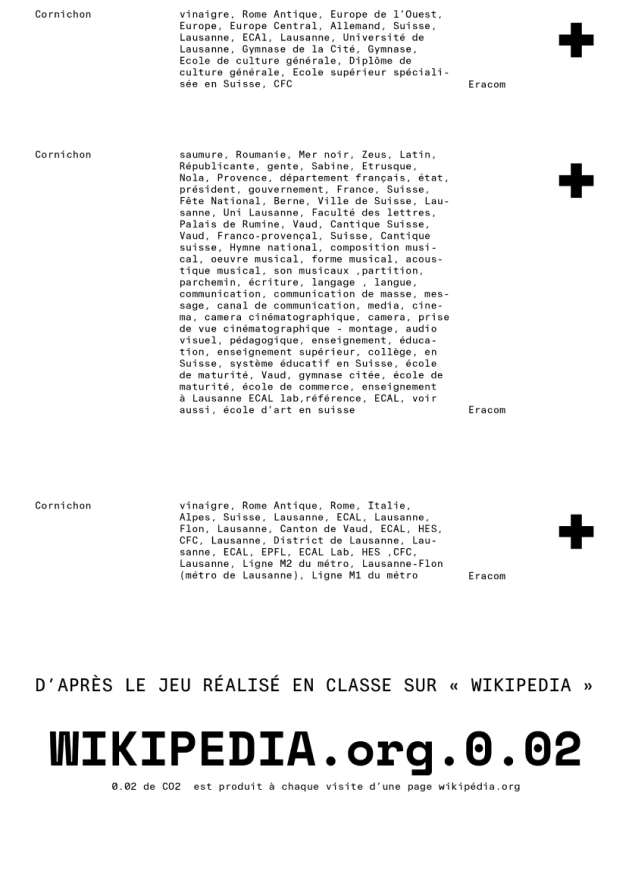
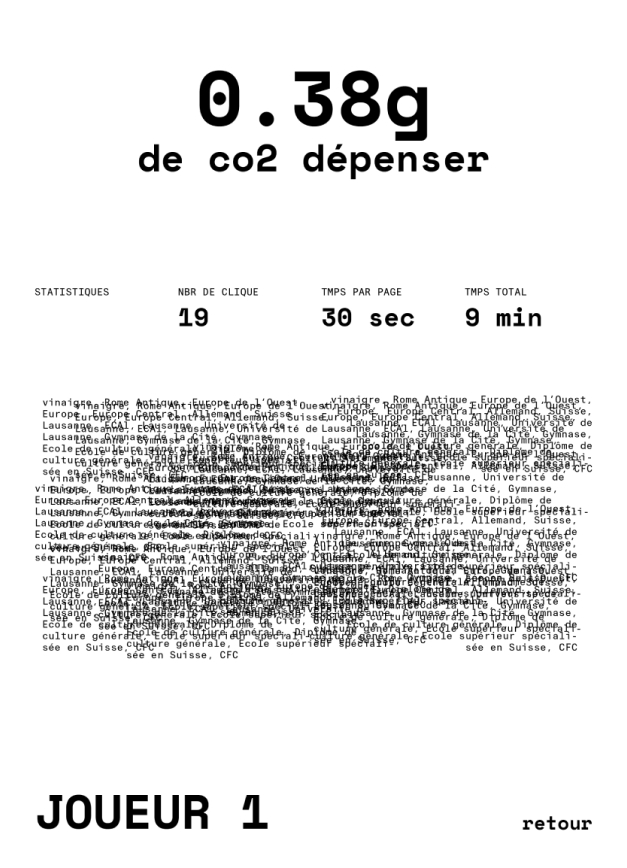
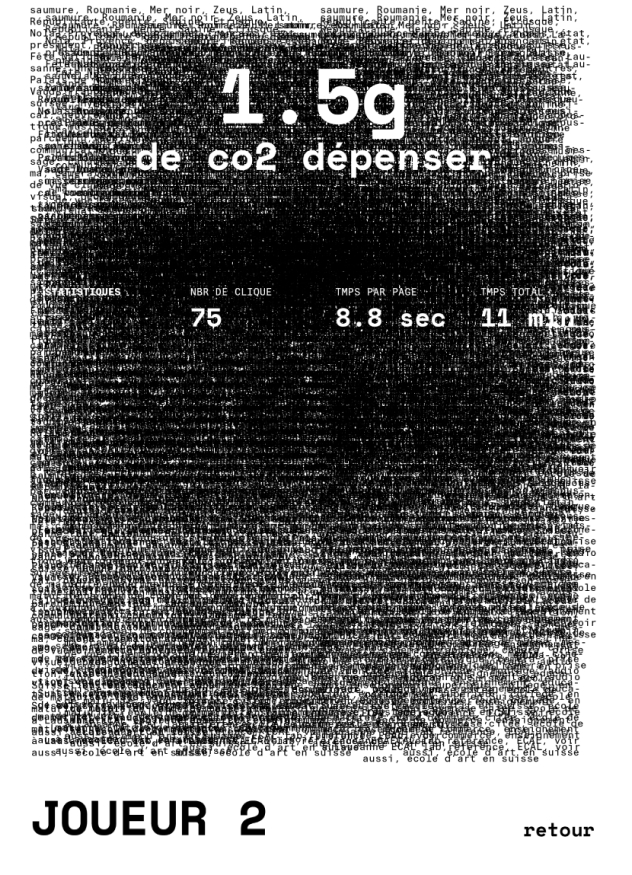
In this project I was able to process data and give it a comprehensive visual with my daily journey from home to school using geospatial data, creating a dynamic cartography. Then, in musical dataviz, transforming complex data into a captivating visual symphony, and in the pixelised representation of Wikipedia searches, processing the co2 consumption per click per search.
01.jpg
02.jpg
02.5.jpg
03.jpg

03.5.jpg
04.jpg
04.2.jpg
04.4.jpg
04.6.jpg

04.8.jpg